Understand the historical context
When you do a website audit you are taking a snapshot of a website at a specific point in time. But that is only half of the picture - it is almost more important to understand how it has changed over time, and what events led to its current state. Sitebulb has a range of features that help give you this historical context, so you can truly understand what you're looking at.
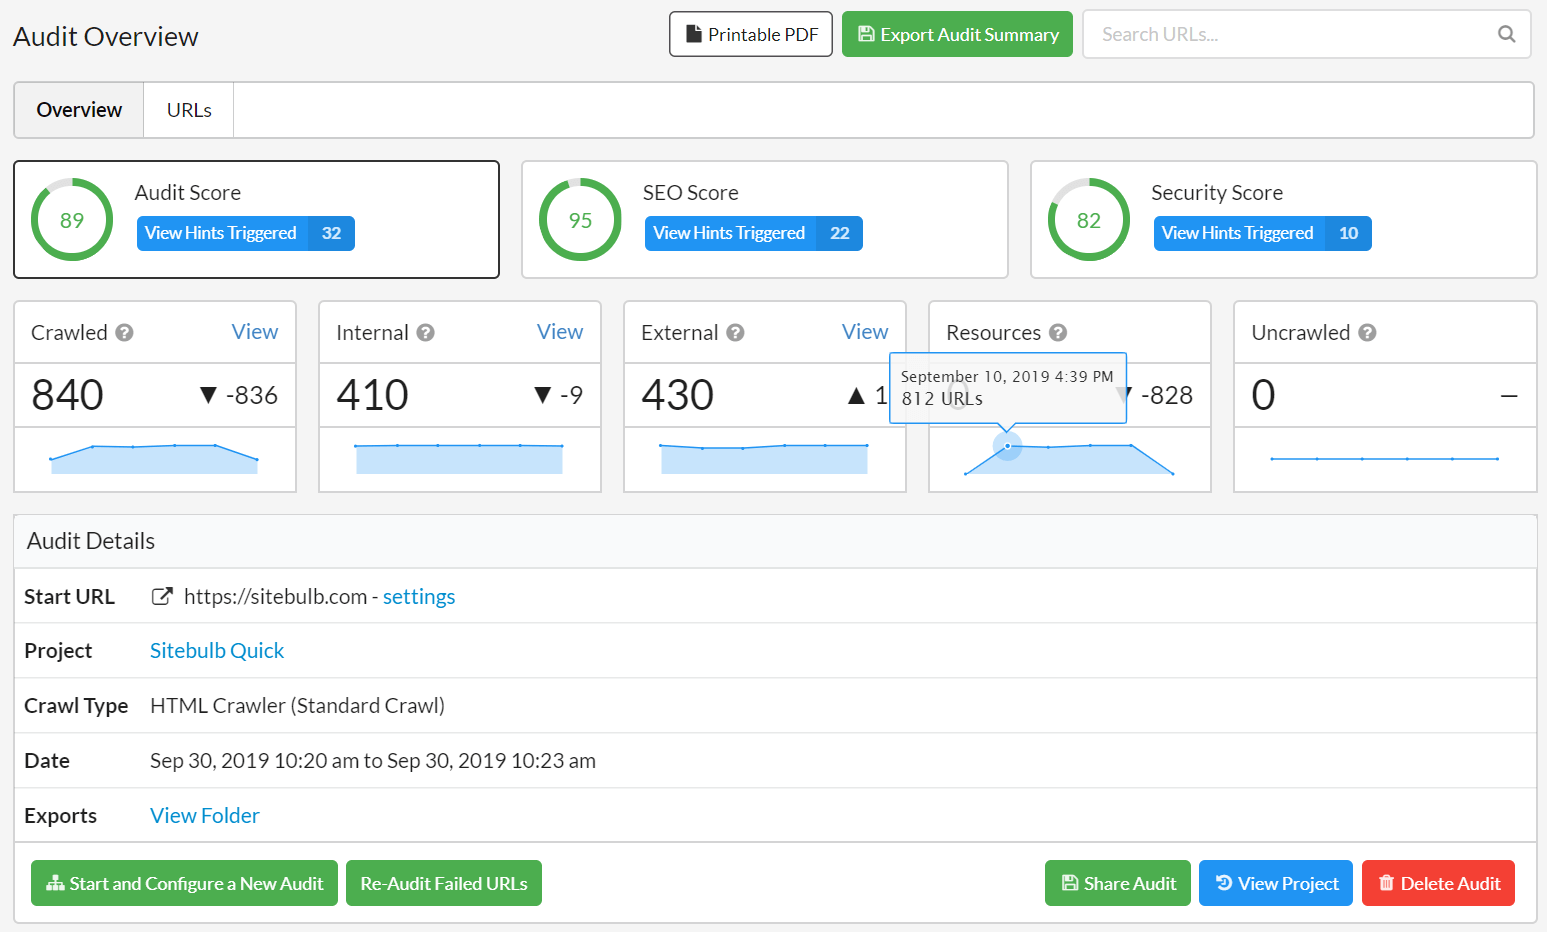
Trendlines for instant understanding
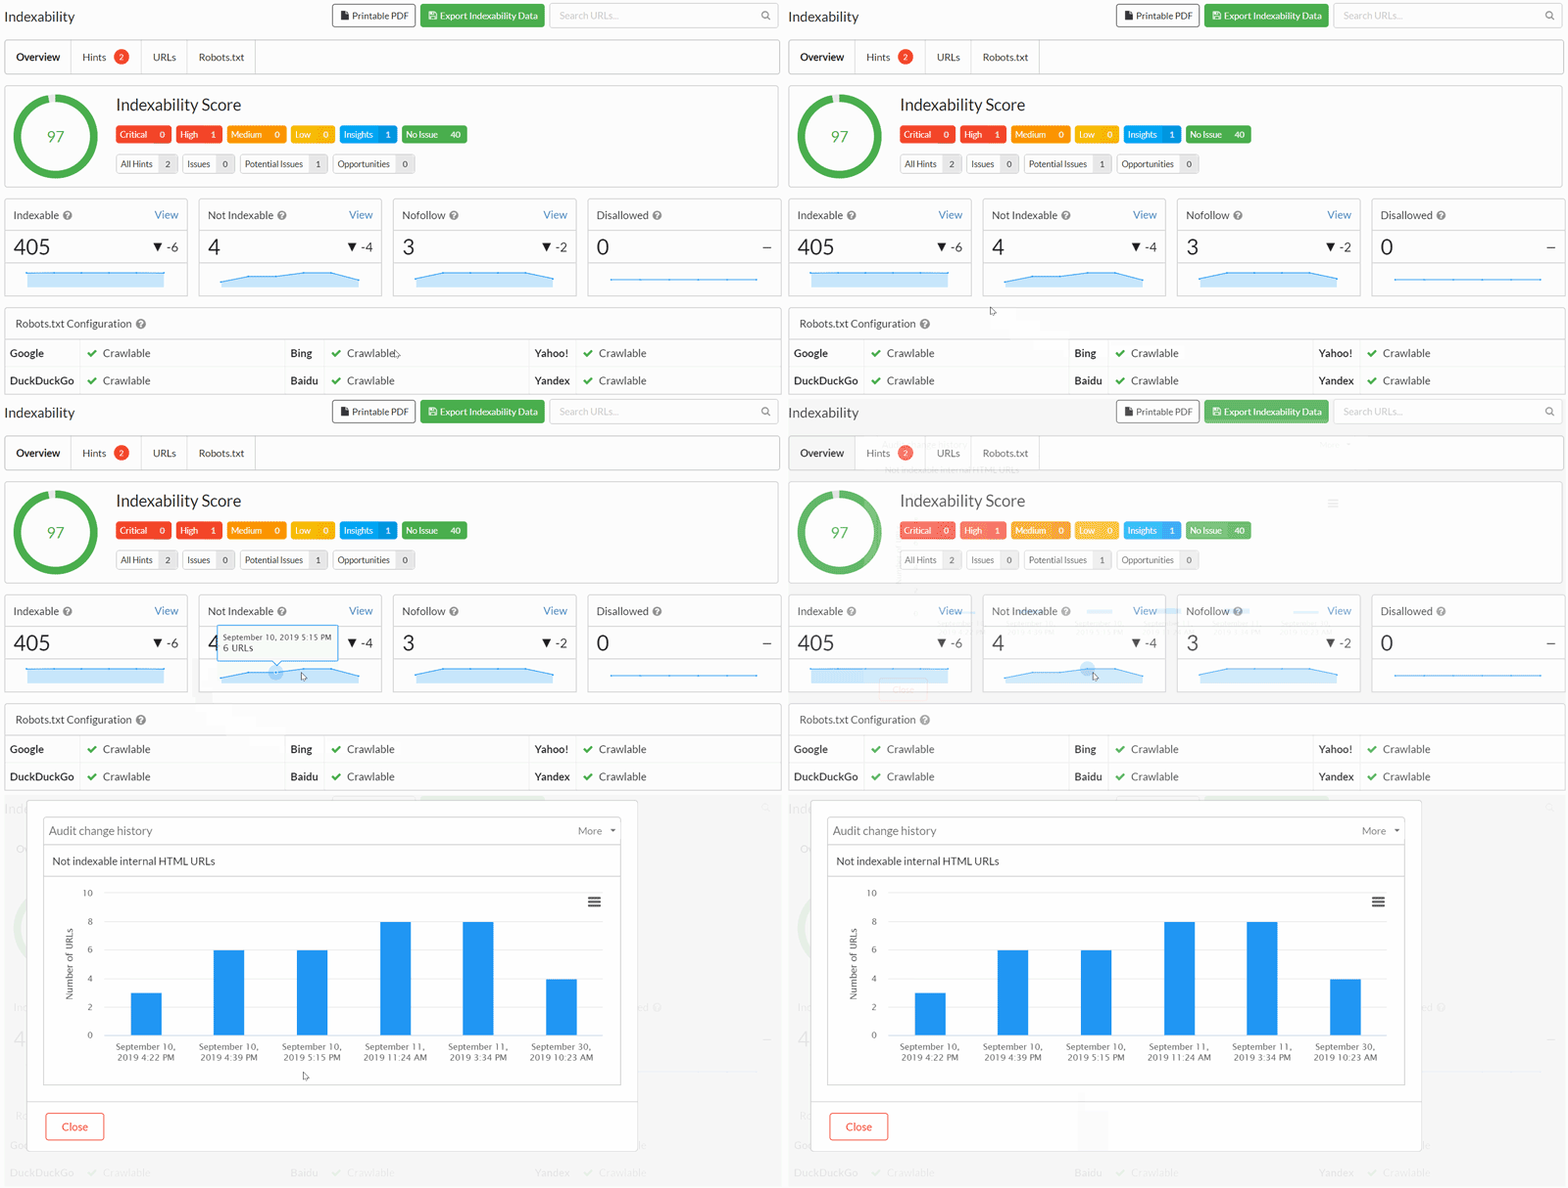
Trendlines tell a story that communicates meaning instantly. You can see exactly how the data has changed over time, and the up/down values tell you the change since the most recent audit. Hover over any datapoint to see the value and timestamp from that audit.

Dig in deeper with audit change history
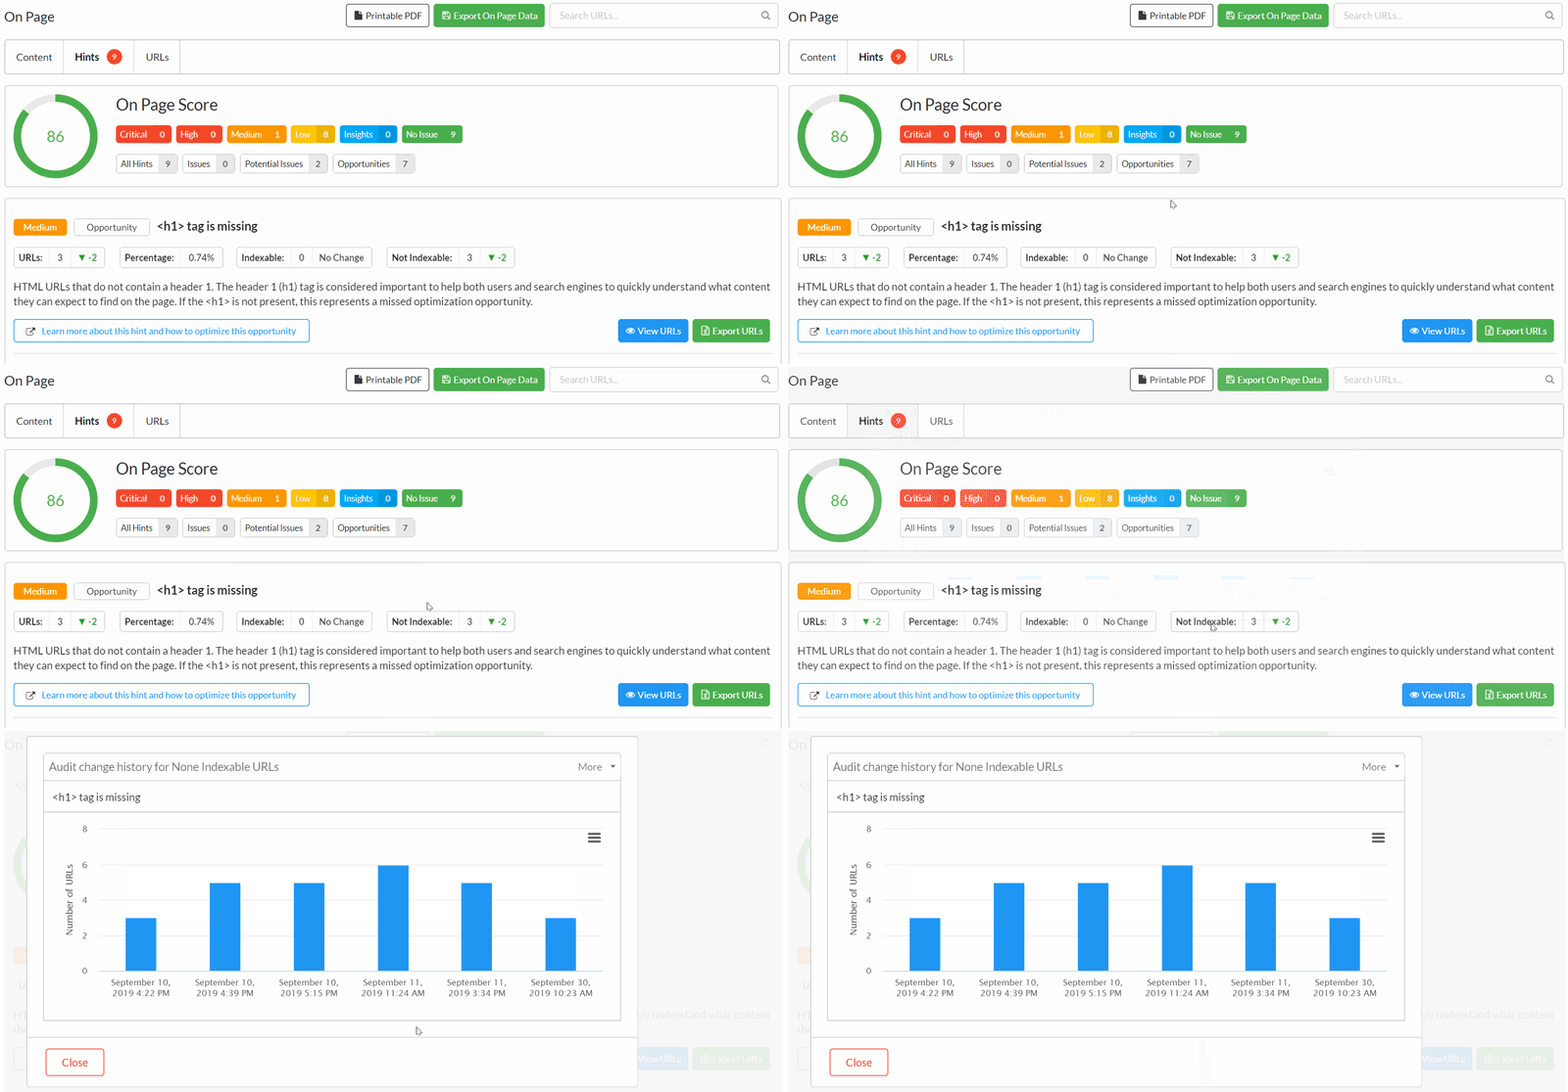
If you need to dig in further or get a clearer picture of what is going on, you can simply click any datapoint to see the 'audit change history' modal - which are perfect charts to include in audit reports and help make an argument.

The change history actually works for any datapoint in the audit, including Hint values.

Compare any two audits
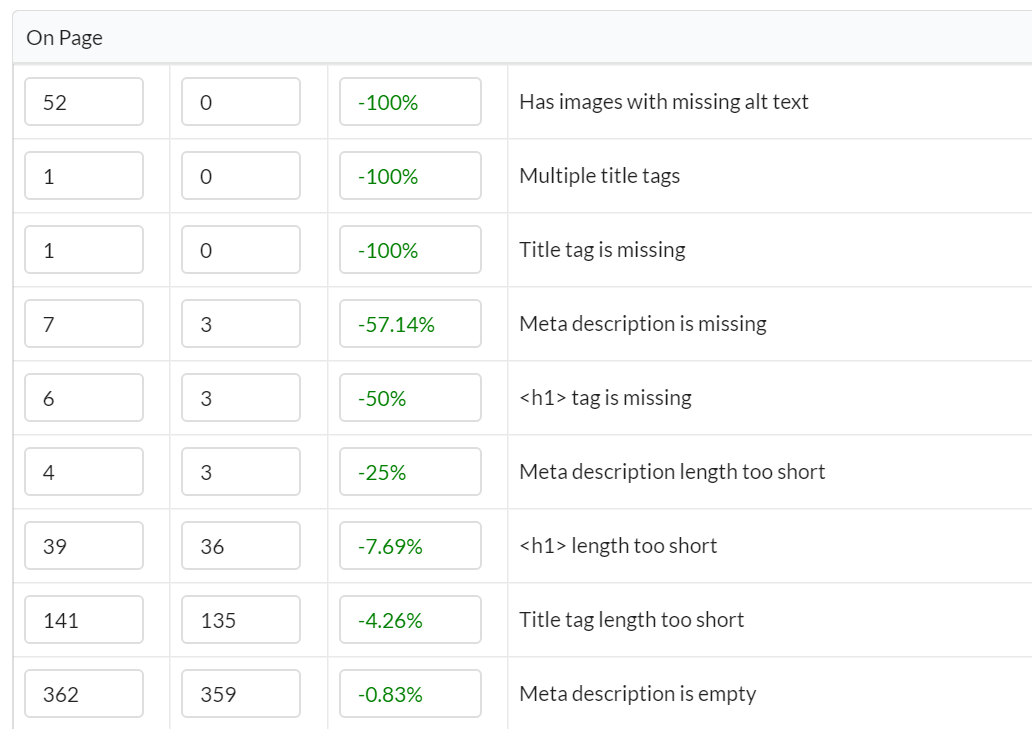
To really understand what's changed between two audits, you can compare every single datapoint recorded on a single screen. This allows you to see the breadth and depth of changes simply by scrolling down the page, and take screenshots to document the changes to your clients.


