There are a range of specific settings and usage patterns that only apply for the Site Visualisation graphs, which you can understand further by reading below (and exploring yourself in the tool!).
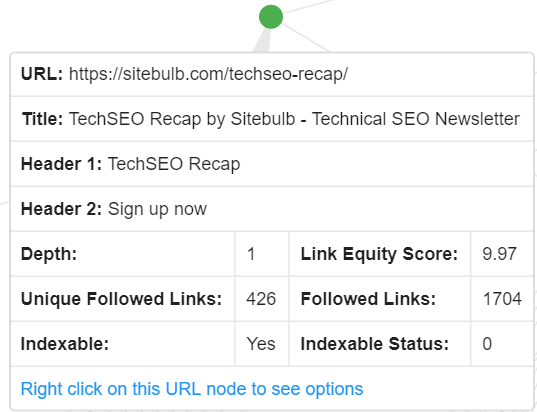
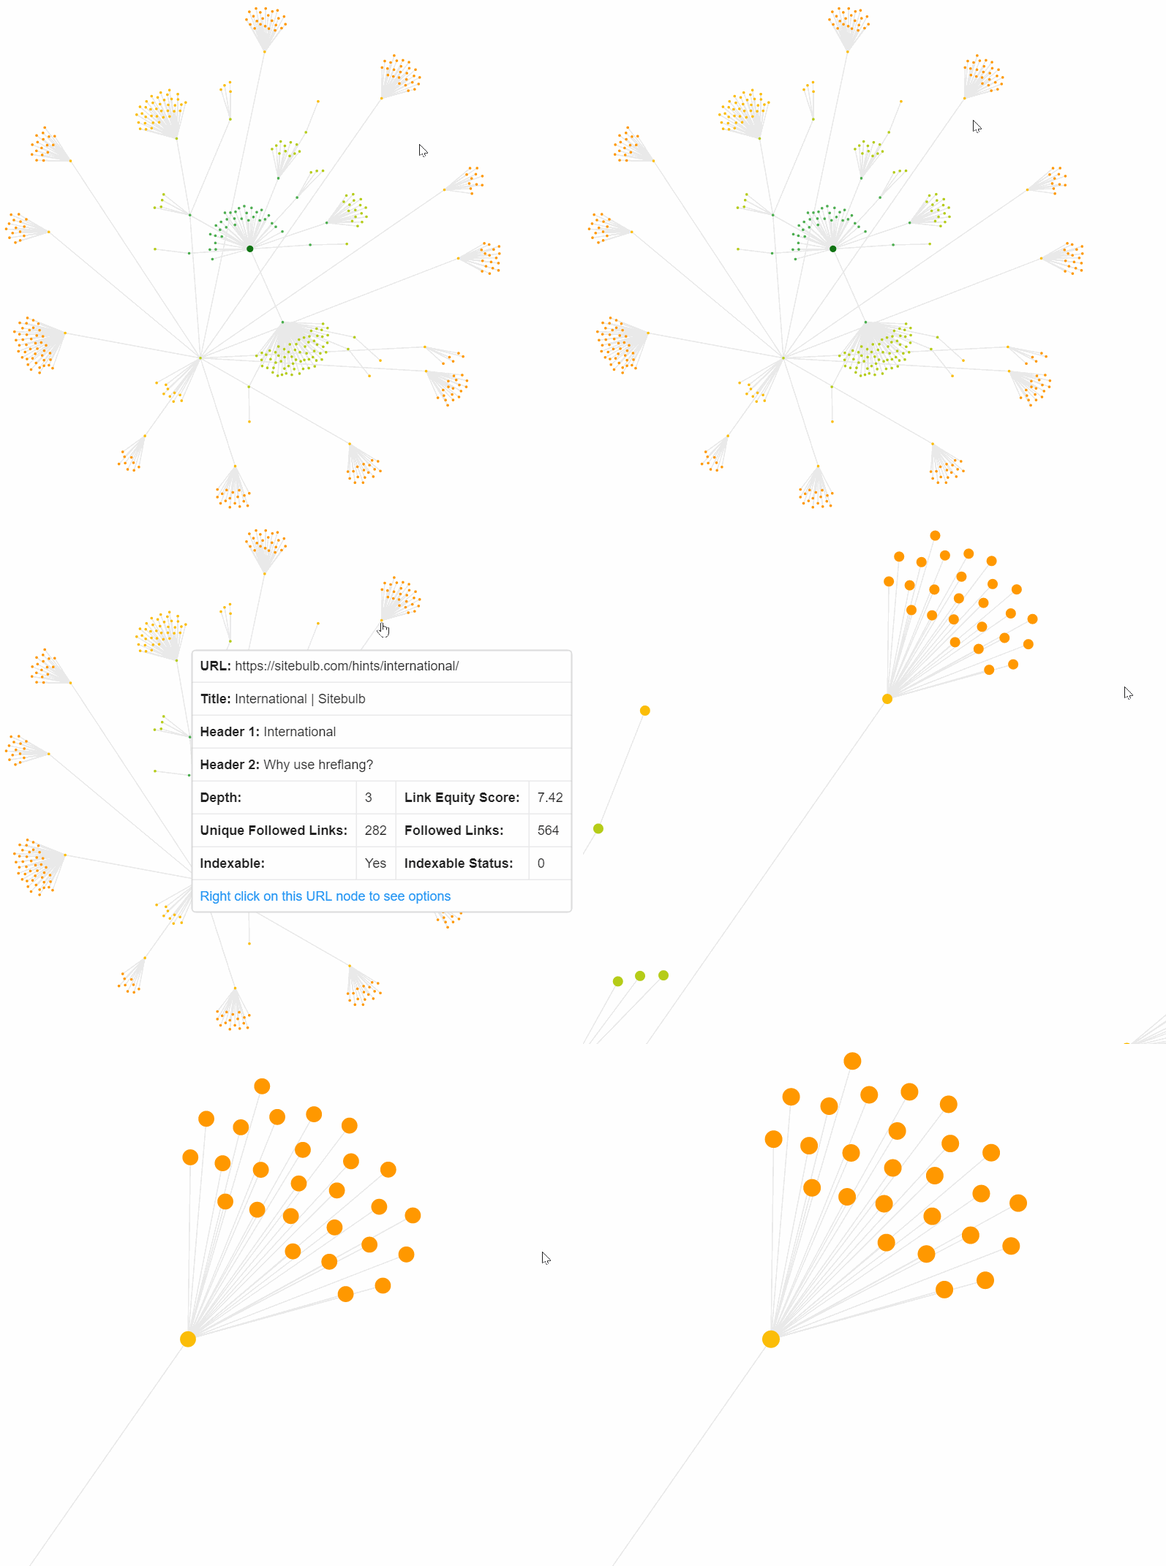
If you hover over any node your will see details of the URL including some link and meta data:
Right-click on the node will bring up a context menu with some futher options:
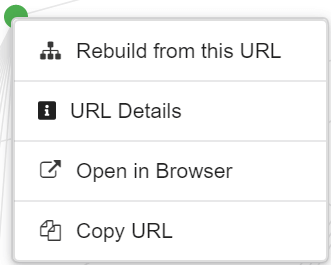
Where 'Open in Browser' and 'Copy URL' are self explanatory. 'URL Details' will slide out the complete URL Details panel for that URL, so you can dig into the details, view the crawl path, export data etc... as normal.
'Rebuild from this URL' is perhaps less intuitive, if you select this then the entire graph will build out again, using this specific node as the starting point. The same result can be achieved by...
Type in a URL, or select from the dropdown, and Sitebulb will rebuild the visualisation as if this URL is the start URL. Like this:
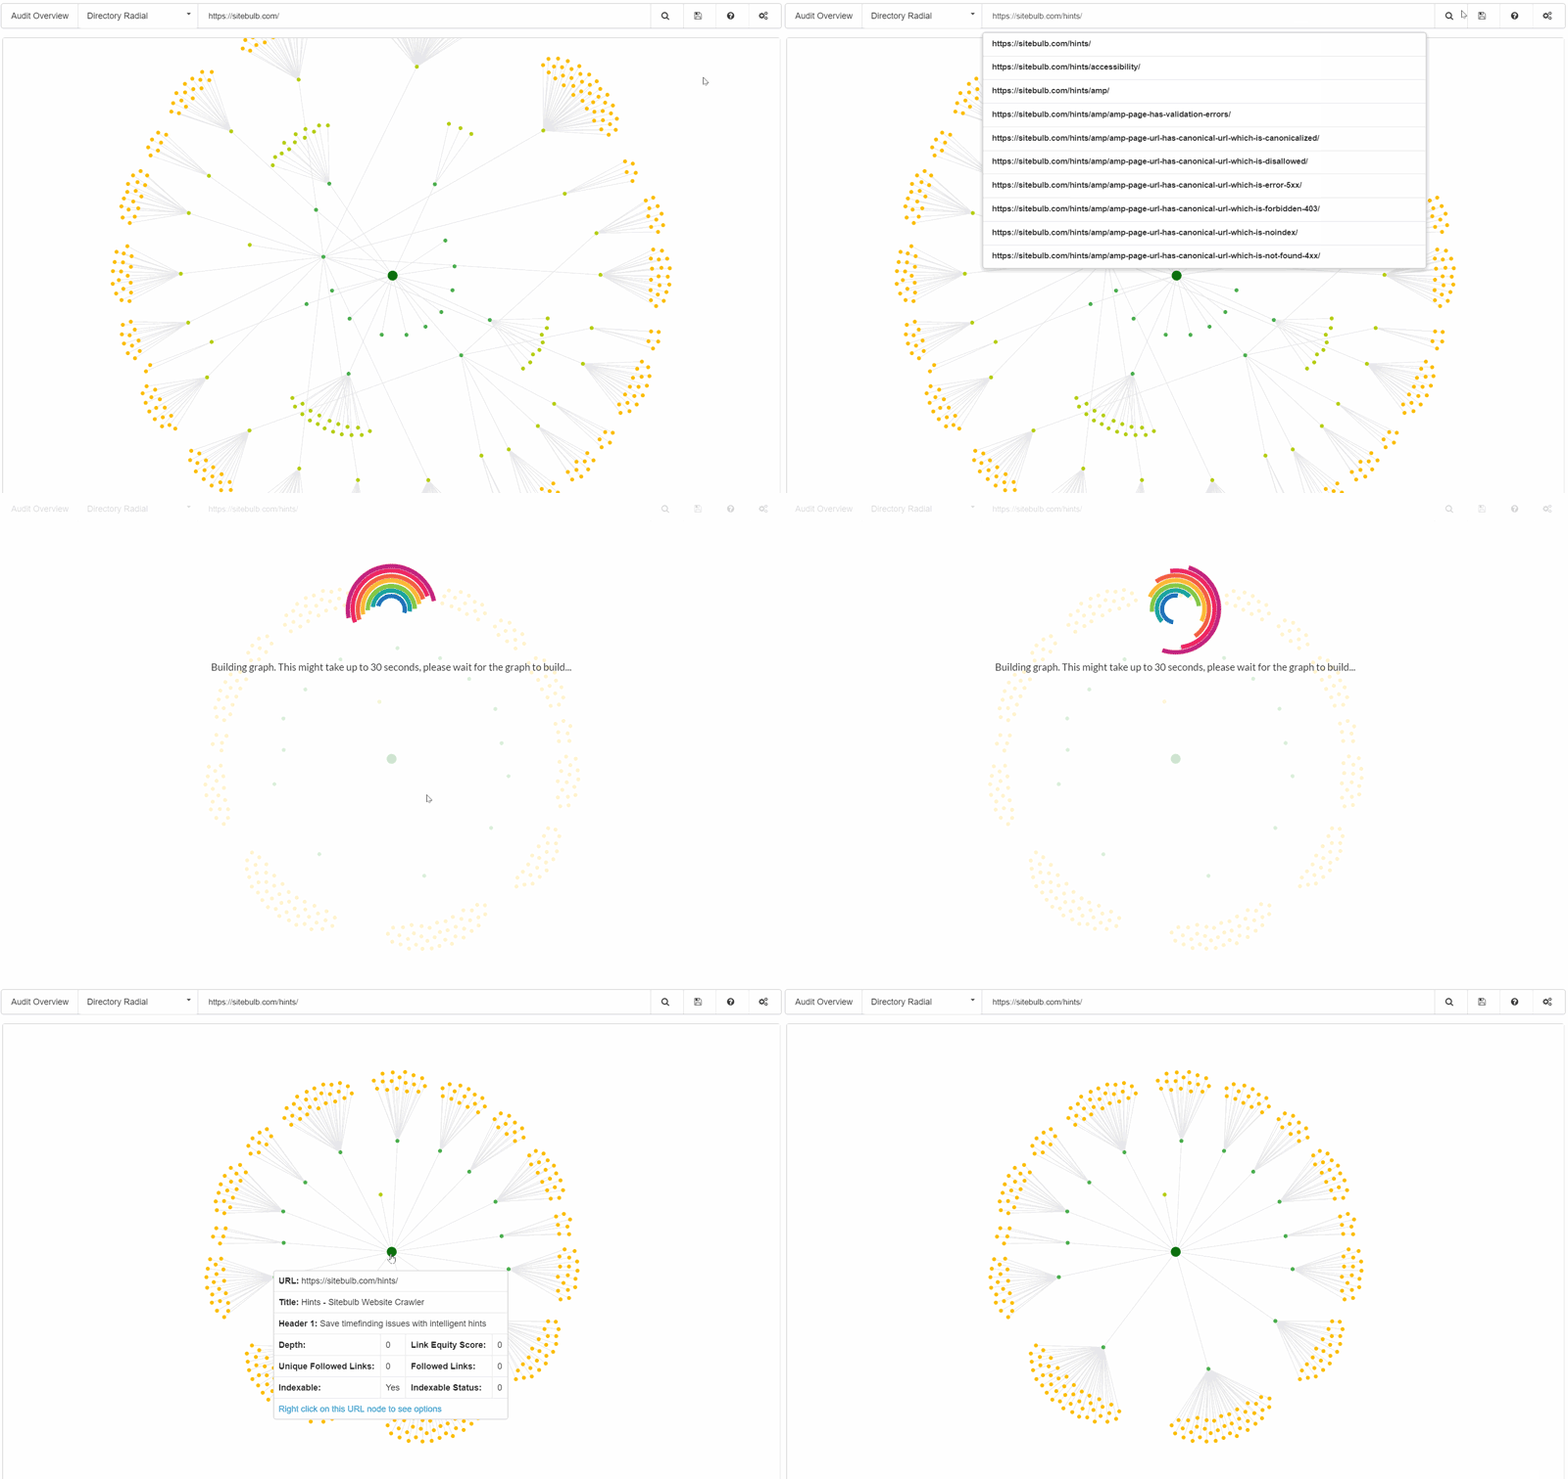
If you want to zoom in on any particular node, just left click and the graph will focus in:
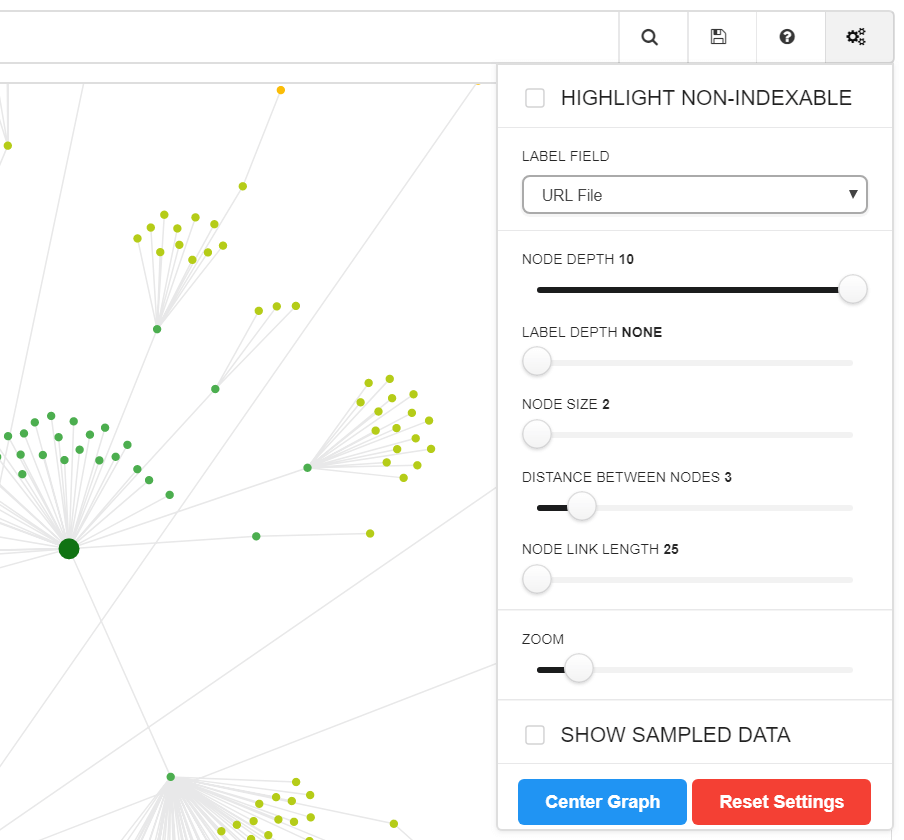
The signature 'settings cog' will open up a panel where various elements of the graph can be configured:
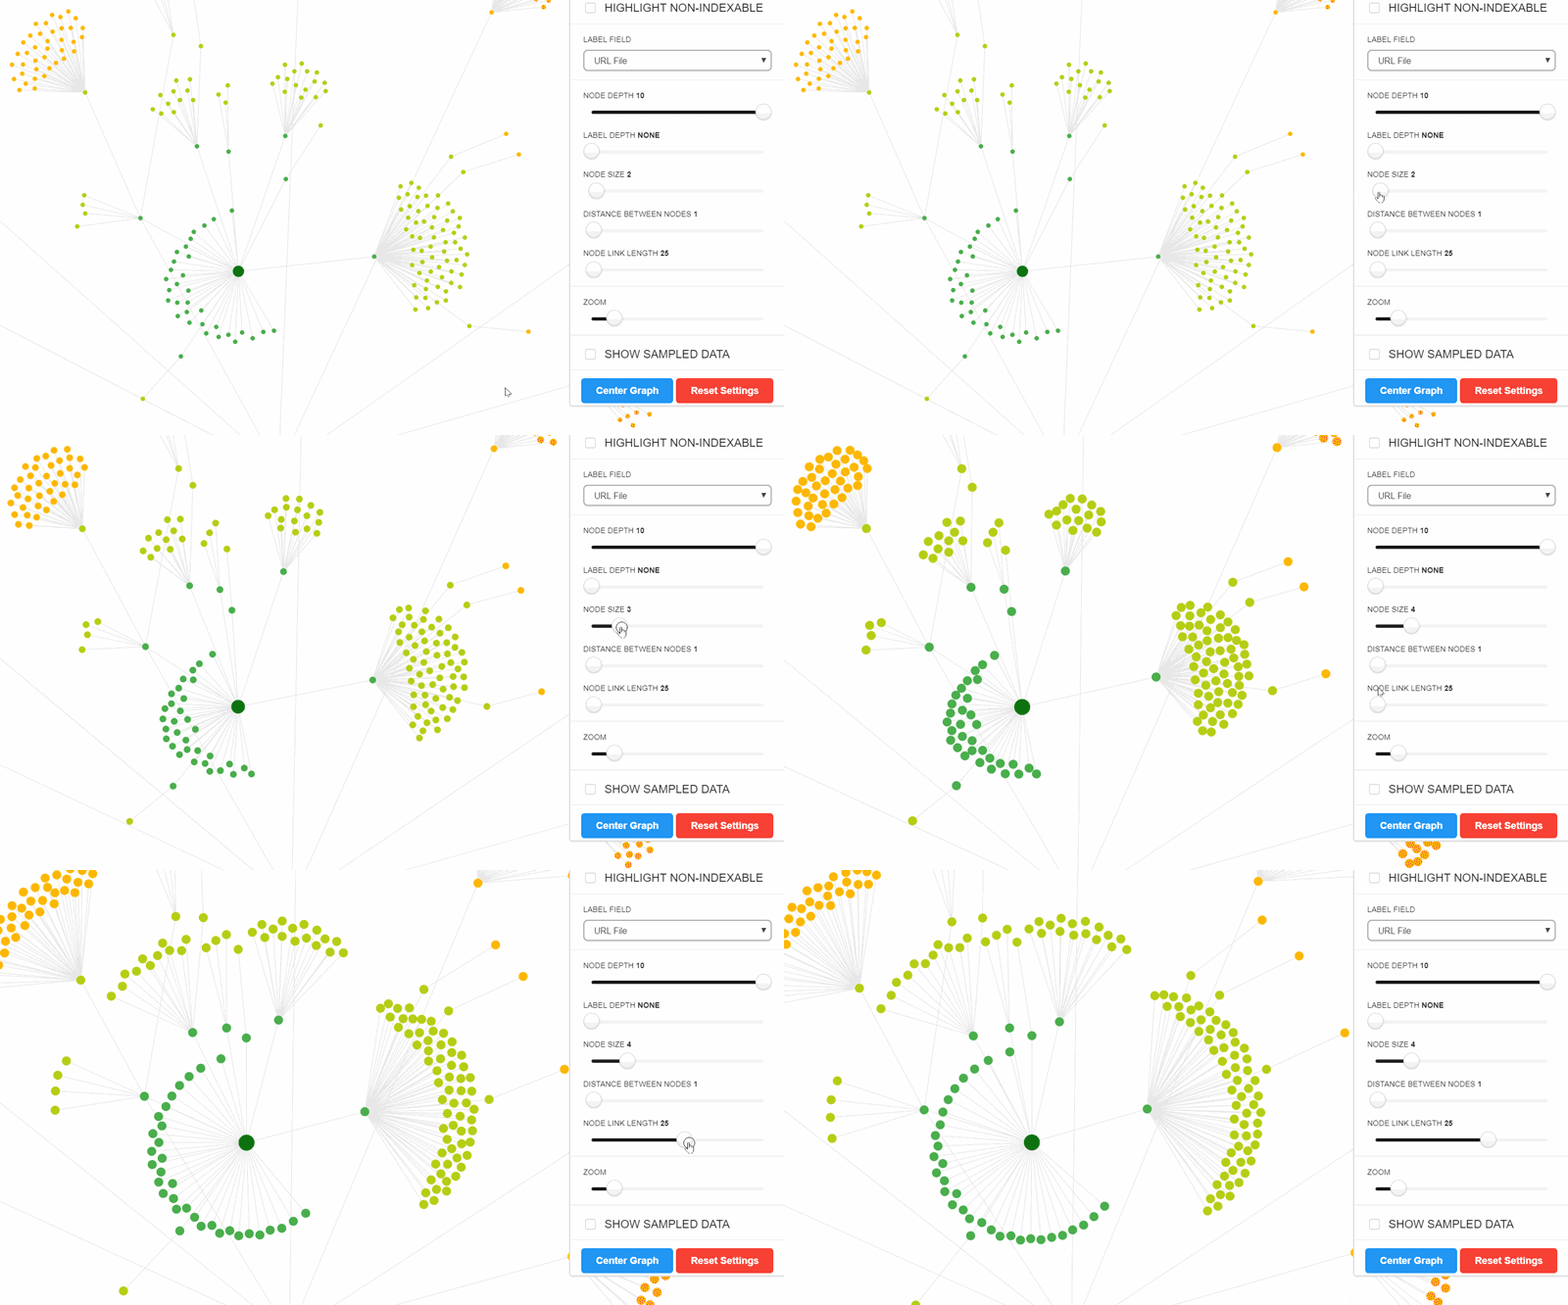
Adjusting these elements will alter the graph 'live', so you can customise and toggle with the sizes to your heart's content.
All the site visualisations map both indexable and non-indexable URLs (up to a maximum of 10,000 URLs). There is a toggle at the top of the settings menu to highlight non-indexable URLs.
On some sites this won't make any difference, but on others it can complete change your understanding of the website.
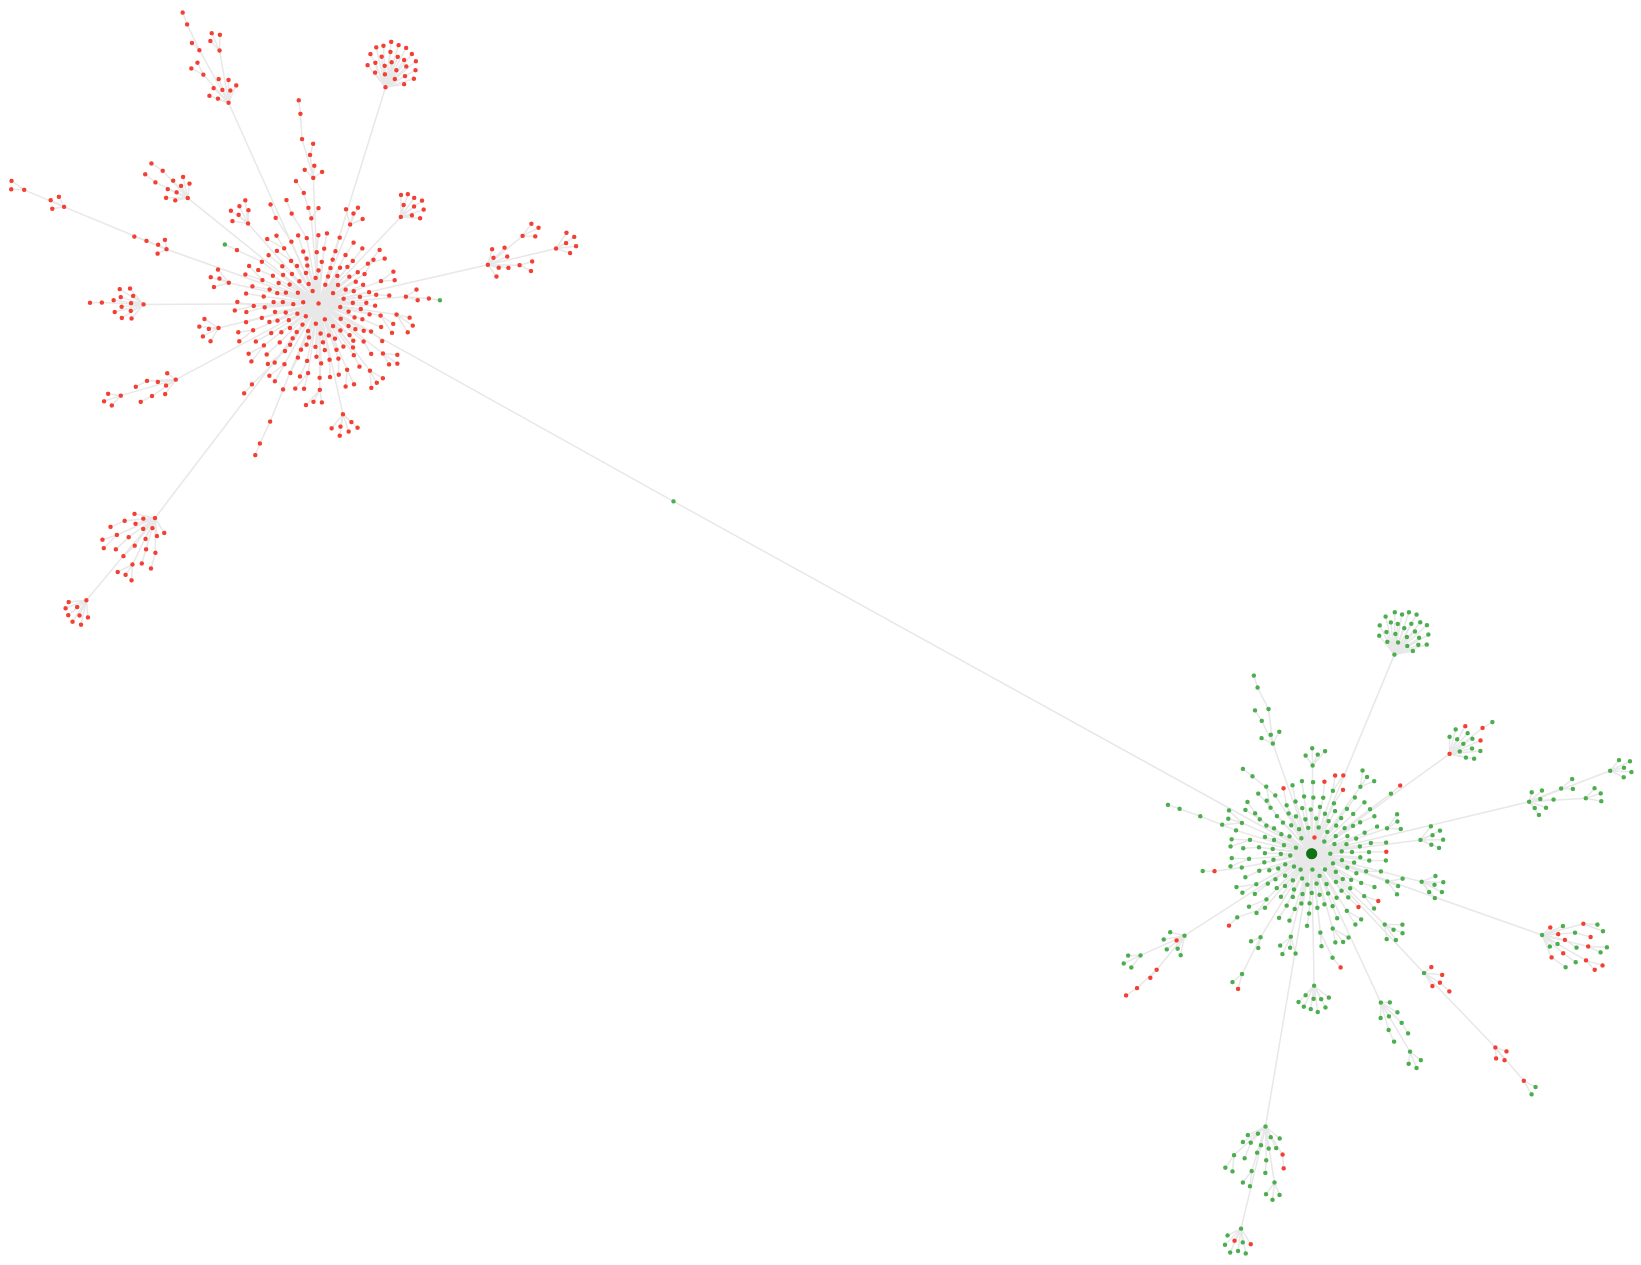
Consider this example, what looks on the surface a relatively normal Crawl Map:
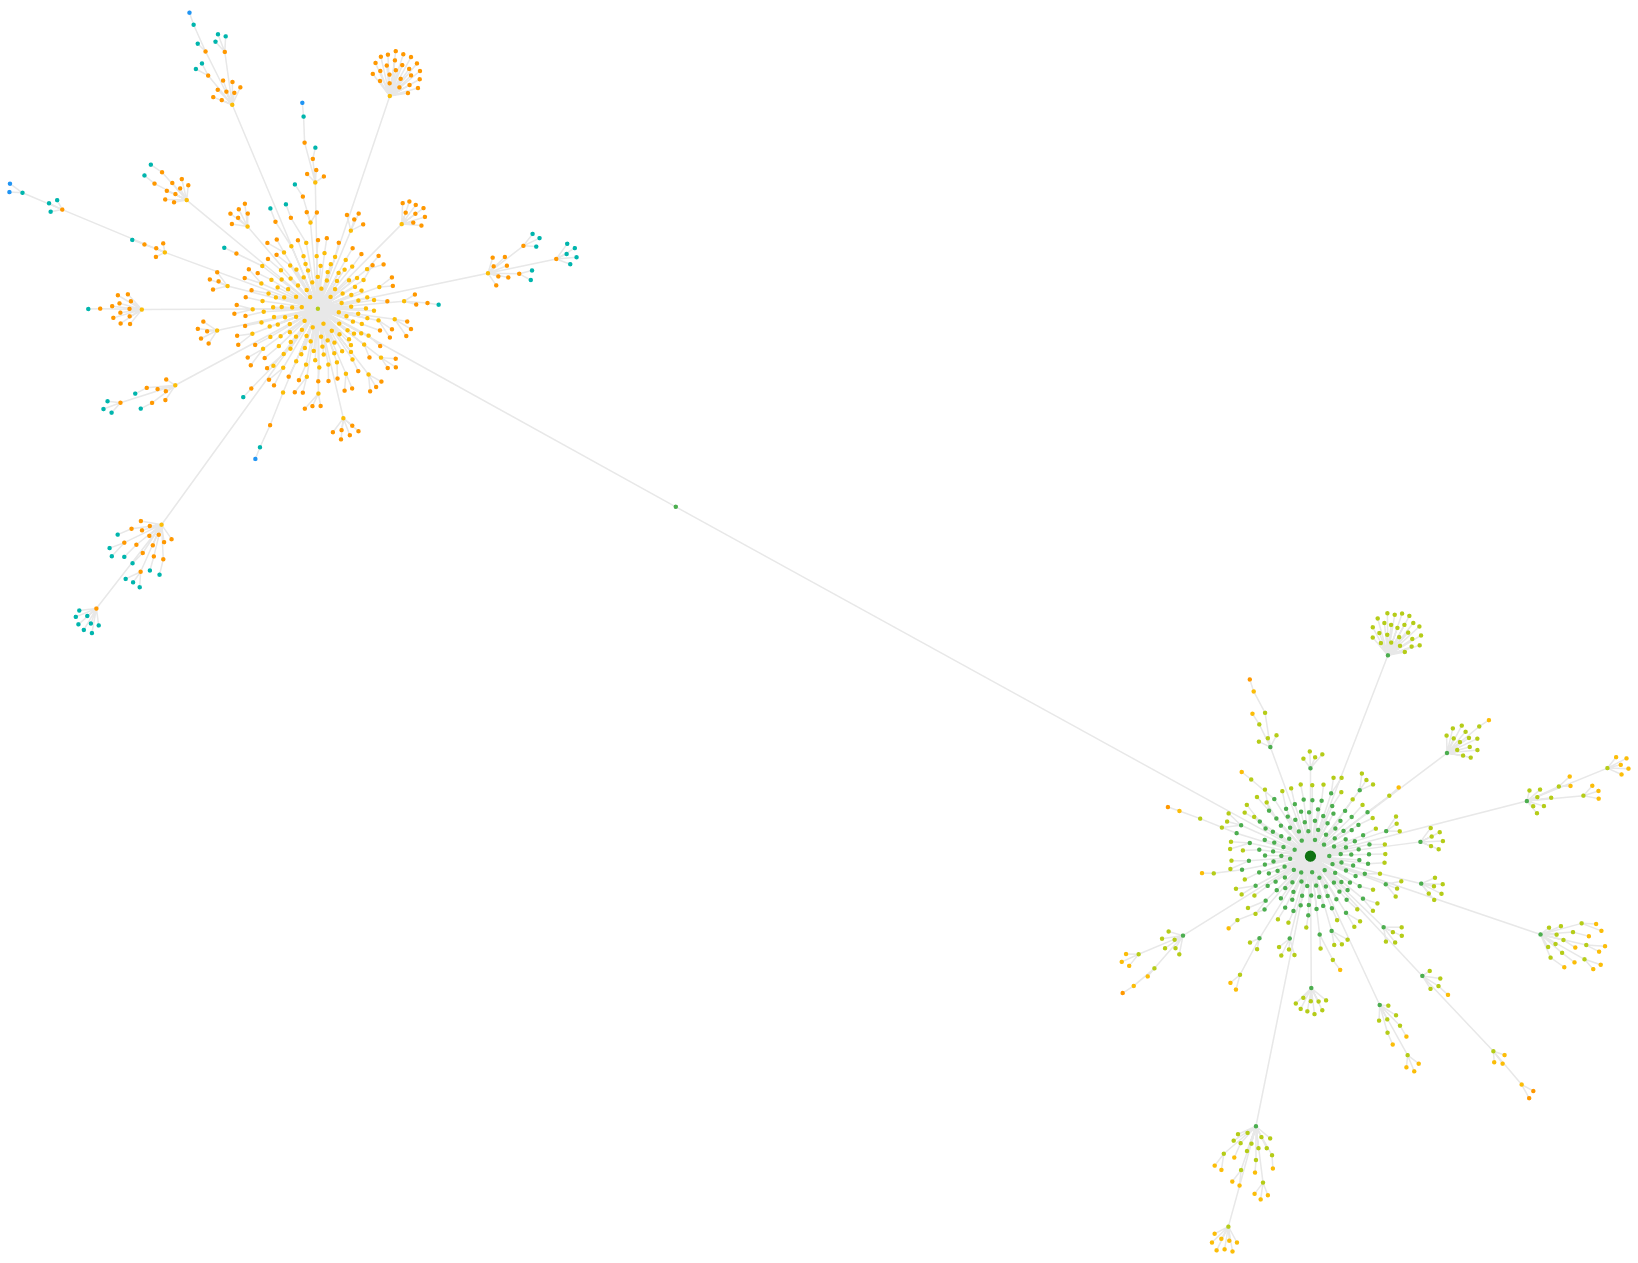
Toggle non-indexable and BAM, you can see that half the map is red (non-indexable) which in this case is due to a massive issue with canonicals:
