This is to do with webpages that alter the HTML during rendering, and specifically ones that change internal links, with JavaScript.
When you crawl with the Chrome Crawler, Sitebulb will render the DOM and parse the rendered HTML. It will also go and grab the source HTML (as in, before JavaScript might have changed anything) and compare all the links between the two.
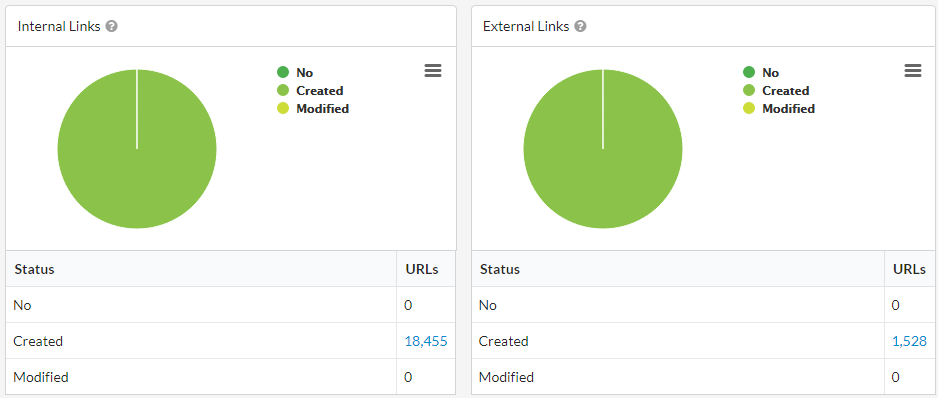
This allows Sitebulb to identify all links that have been affected by JavaScript, and surface these via the Response vs Render report:

Clicking through any of the chart segments, or the linked numbers in the data table underneath, will show you the link data via the Link Explorer, which includes the column 'JavaScript Status':

The options we have for this column are as follows:
So the Link Explorer allows you to interrogate the data en masse, and if you want to zone in on particular URLs or particular links, you can also see the data listed on the URL Details page.
On both the outgoing links:

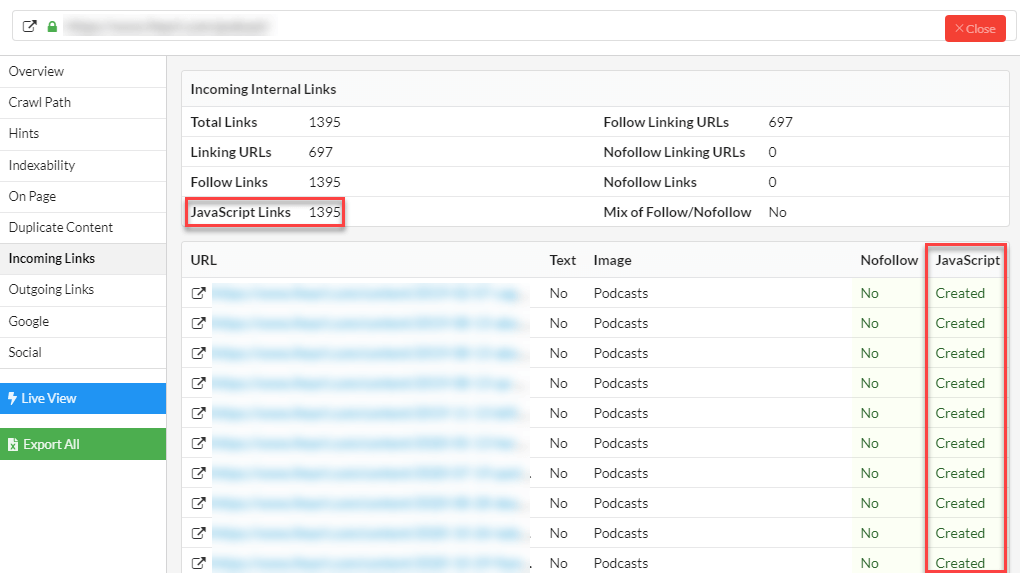
And on the incoming links:

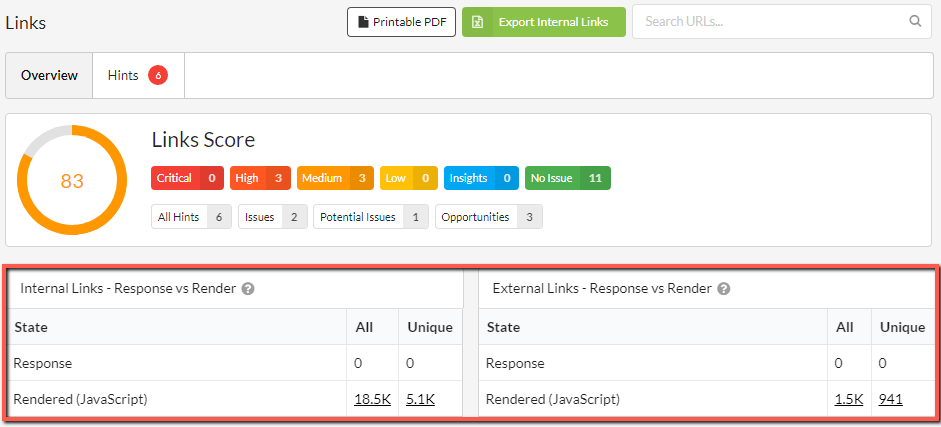
JavaScript links are also surfaced in the Links report itself, in the data tables below:

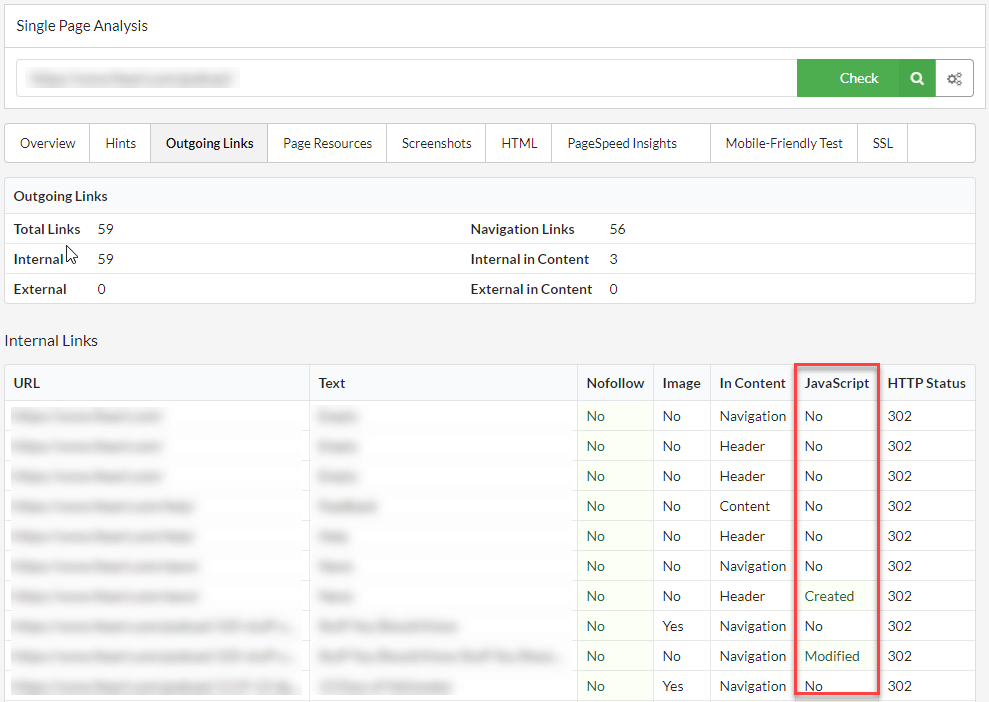
Independent of any audit, if you want to evaluate a single page, this data is also available in the Single Page Analyser:
