Sitebulb's performance testing allows you to check performance data across an entire website, without needing to connect up to external APIs or hit every page with PageSpeed Insights having already crawled all the pages first.
This works by utilising Sitebulb's in-built Chrome crawler, which can collect Web Vitals lab data and perform optimization checks as it crawls the website. Since no one in their right mind needs lab data for every page on the website (and it uses up CPU), we have built-in a system to easily sample the URLs chosen for web vitals.
In summary, Sitebulb's performance report allows you to:
This article will cover how to go about setting up a performance audit, how to access your results, and how to understand the Lighthouse rules.
Sitebulb collects performance data directly from headless Chrome as it crawls. So in order to run the performance report, you need to select the Chrome Crawler when you set up your project. At this point in time it is also worth considering if you wish to run a mobile or a desktop audit, which you can control with the 'device' dropdown:
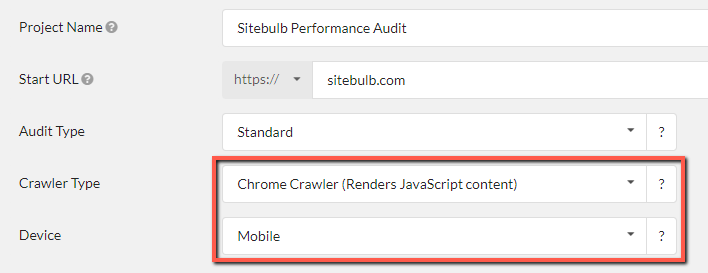
If you are not sure which option to choose, go with mobile (since poor performance is normally more noticeable on mobile).
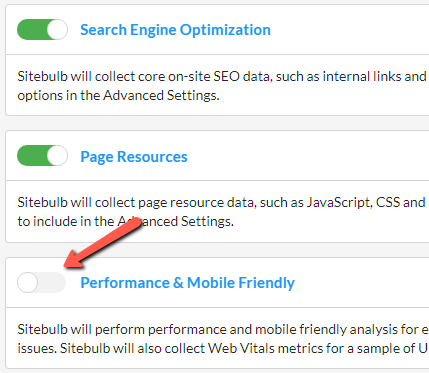
Once the pre-audit is complete, you will be presented with the project setting options, and you will need to click to turn on 'Performance & Mobile Friendly':
Once checked, this will immediately open up the advanced settings options, which will allow you to select the level of sampling you require, and to toggle off/on the Code Coverage and Parse Technologies options.
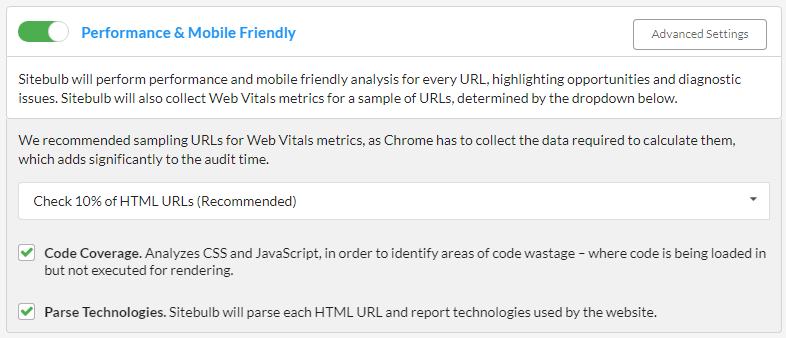
We recommend sticking with the default 10% sampling rate, which means that Sitebulb will collect Web Vitals metrics for every 10th URL it encounters (after the homepage). For more details, please read our guide on sampling, however the main thing to note is that sampling only affects the collection of Web Vitals, all of the optimization Hints will still be checked for every single page crawled.
You will also notice another section in the advanced settings, marked 'Performance Budget Configuration.' This is a more advanced option, and we have a complete guide on setting performance budgets, please refer to that if this is something you would like to explore further. If you are unsure what a performance budget is, just ignore this section entirely, it will not affect your ability to carry out a performance audit.

Once you are done setting up, hit the green button to start your audit and let Sitebulb run.
Once the audit is complete, you will be able to find your performance data by clicking the 'Performance' menu option on the left, which opens up a report like this:
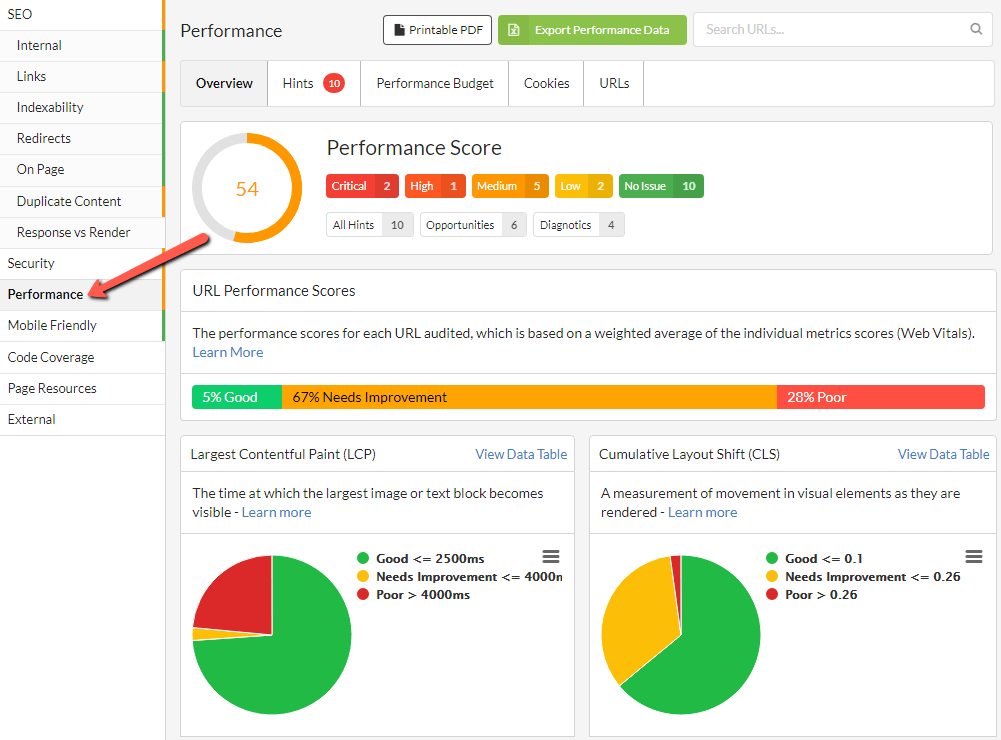
As you can see, there is a lot of information! We'll step through it all section by section:
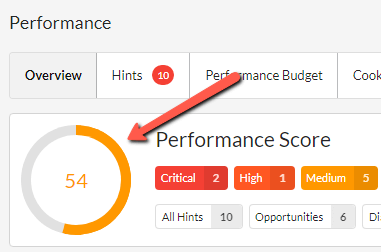
The first thing you see is the big Performance Score at the top, followed by the green/orange/red bar underneath showing the individual URL performance scores.
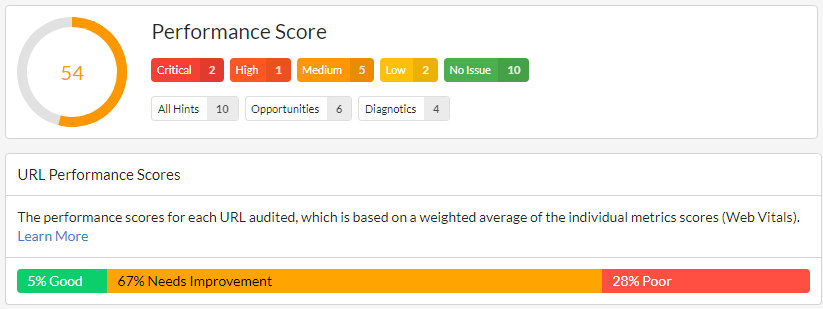
The big score at the top relates to the overall average score of the website, for all URLs tested. The green/orange/red bar shows how the URLs split out individually.
These scores are based on the following thresholds:
So in the example above, only 5% of the page achieved a performance score of 90 to 100. The score of 54 at the top is the average (mean) of all the individual URL performance scores.
These scores are based ONLY on the URLs that were sampled, and ONLY using Web Vitals metrics. Please note that this is in fact different to all the other reports in Sitebulb, which have a score based on the number and type of Hints triggered. The performance score is independent of the Hints.
I have still not explained where these scores come from in the first place. They are based on the Lighthouse Scoring Calculator, which takes Web Vitals data and translates this into a weighted average:
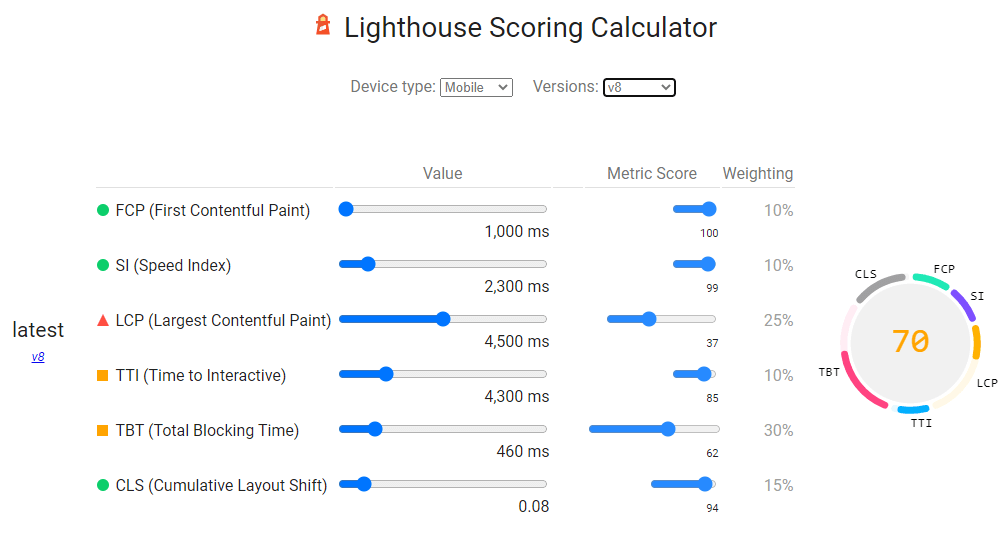
As you can see, the furthest right column shows the weighting, so the FCP contributes 10% to the score, whereas LCP contributes 25%, etc...
Sitebulb does the same thing - for every URL sampled, it calculates the Web Vitals scores, then applies the weighting like above to end up at a performance score for the URL.
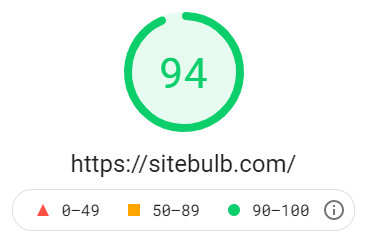
This is just like when you see a single URL score in Lighthouse or PageSpeed Insights:
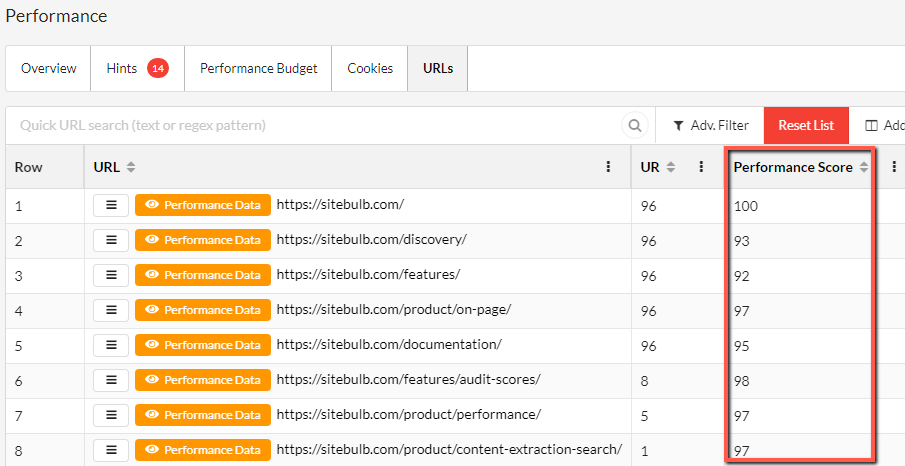
To see individual URL scores in Sitebulb's performance report, you can click through from the chart:

To end up at a list of URLs, where you can see the performance scores in the third column.
You can also click the orange Performance Data button to isolate a single URL and see all the Web Vitals metrics, along with the score:

And finally just to re-iterate, we have just explored how to dig in and look at the performance score for an individual URL, but the big performance score at the top is the average of all the URLs that were sampled:
On the audit overview, directly underneath the performance scores, you will see the Web Vitals charts:

Each metric has a set of thresholds for Good/Needs Improvement/Poor, so each URL falls into one of those 3 buckets for every metric. This means you could have a URL that has a 'Good' LCP, yet a 'Poor' CLS.
If the metrics themselves are unfamiliar to you, the links below (will open in a new tab) represent my best attempt at a 'plain English' explanation of each of the metrics, so you can get a clearer understanding of how they fit alongside one another:
Note: It is not obvious, but makes sense when you think about it: for most of the metrics, the threshold values for Good/Needs Improvement/Poor are different whether you use a the Desktop or Mobile crawler (see the links above for clarity on the specific thresholds). The idea being that desktop users will normally have access to a better network, therefore you need to try harder to be considered 'good.'
If you are looking at these pie charts and wish to dig into the data further, you can do this by clicking on the relevant pie chart segment:

This will bring you through to a URL List that contains all the URLs within the segment selected:

At this point, analysing the URLs to identify patterns in the URL structure can allow you to isolate specific HTML page templates that all share a common issue (e.g. 'Poor CLS on product pages').
Sitebulb collects performance data directly from Chrome as it crawls, and throttles the CPU in order to emulate a 'Slow 4G' network, the same way that Lighthouse do it.
You don't need to select any settings to enable throttling, Sitebulb will just do this by default.
The performance scores and Web Vitals data essentially provide ways to measure page speed and user experience, both at a URL level and in aggregate across the site as a whole.
However, they don't provide any assistance in terms of what you can actually do to improve the metrics.
This is where Sitebulb's Hints come in:

These Hints are processed for every single URL crawled, not just the ones sampled for Web Vitals.
The Hints split into two different categories:
These reflect the same issues that Lighthouse use, and we have deliberately used the same wording so you can match the issues up when digging in further with Lighthouse.
What this effectively means is that when you run a performance audit with Sitebulb, you can run the Lighthouse ruleset against every single one of the URLs on your website.
Like other Sitebulb Hints, they have an importance level attached: Critical, High, Medium or Low, which is based on the likely impact of resolving the issue.
And just like the other Hints, they have a 'Percentage' value which tells you the extent of the issue across the whole site, and a 'Learn more' link at the bottom, which will take you to a full description of the issue on the Sitebulb site:
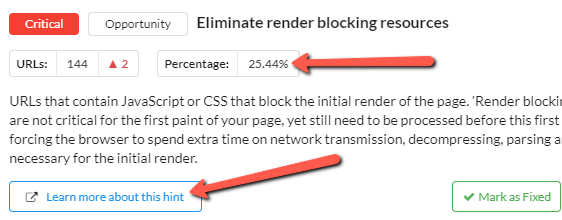
The combination of the Hint importance and the coverage percentage should give you a feel for which Hints you might want to prioritize first in terms of further investigation. On the flip side, you might want to use them as insight for which Hints to ignore for now (e.g. 'Low', 10% coverage).
Either way, once you decide you wish to dig deeper, you can do so by pressing one of these buttons:

As an example, consider the Hint below, which picks out pages that have images which could use further optimization:

If I click 'View URLs', I can see the URLs which contain images that need further optimization:

The data columns highlighted above help you understand the scale of the issue on each URLs, so you can determine if you want to explore further. For instance, you can sort by the column 'Images not Efficiently Encoded' in order to highlight the worst offenders.
The other blue button, 'View Resources' shows the image files themselves which need further optimization:

This time, the highlighted columns tell you data regarding the specific image URLs themselves. This allows you to sort either by the images which will benefit most from optimization (the column 'Encoding Image Saving' shows you this) or by the images which are most prevalent across the site (the column 'No. Referencing HTML URLs' shows you this).
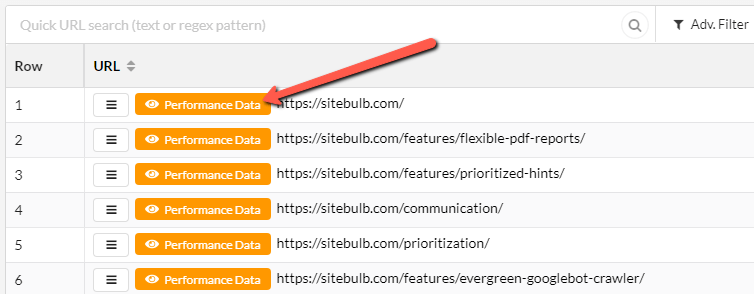
Finally, you may wish to investigate a specific URL from a performance perspective, and you can do this directly by clicking the orange Performance Data button alongside the URL you wish to investigate:
This will open up a window that shows the URL Details panel, which essentially is all the data that Sitebulb has collected for this specific URL. Since you clicked the orange Performance Data button, it will automatically land you on the performance tab:
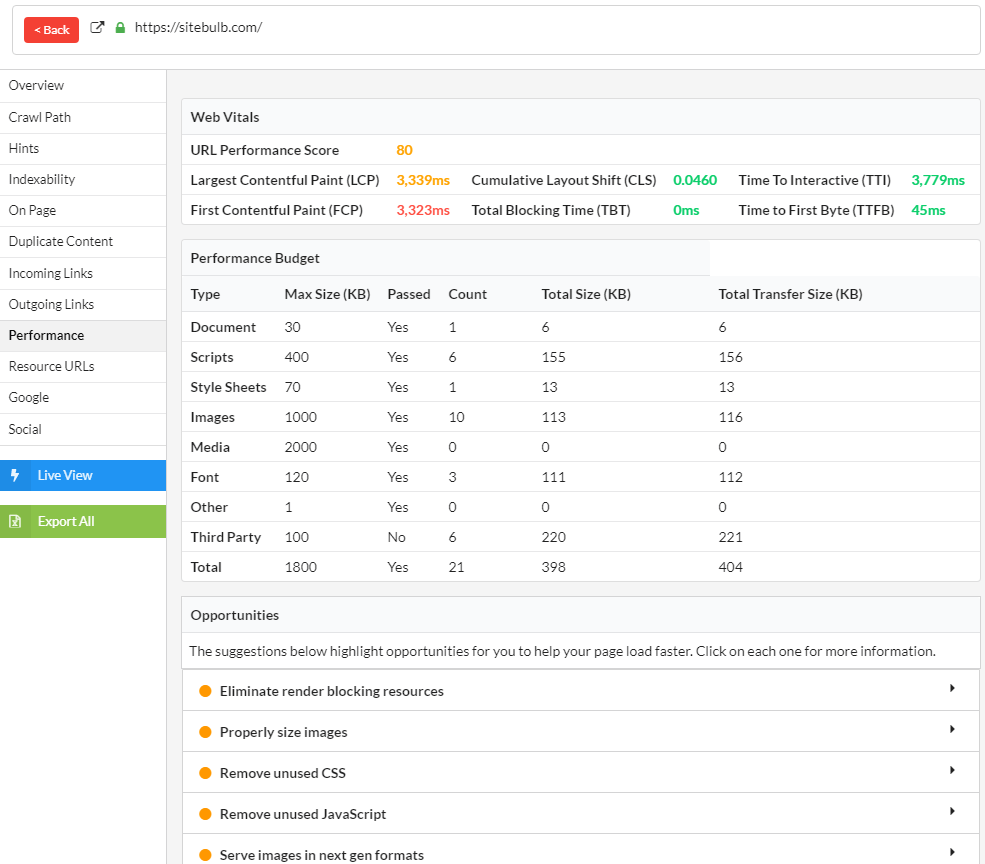
Underneath the Web Vitals data and the Performance Budgets data, you will see that the triggered Hints are also displayed, in the form of Opportunities and Diagnostics.
Clicking on one of these Hints will open up a dropdown with further information - the Hint description, along with the details of the resource files that triggered the Hint for this specific URL.

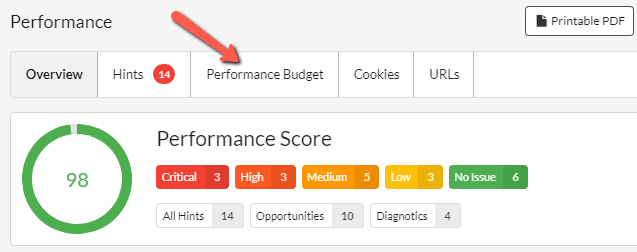
The final tab to consider is the one marked 'Performance Budget'. I mentioned it earlier during the audit configuration that this is a more advanced option, and we have a complete guide on setting performance budgets, but even if you don't want or need to utilise the full power of a performance budget, there are some useful ways things you can do with it.
To find the collected data, click on the Performance Budget tab.
Scrolling down you will see a performance budgets chart:

And then underneath that, the same data in table format:
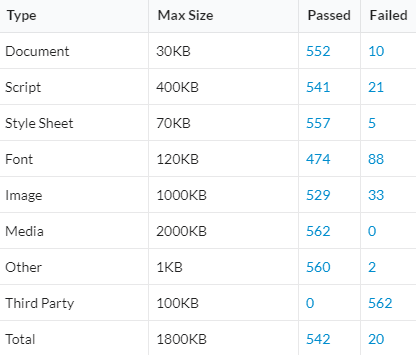
The first column shows the type of page resource, and the second column shows the maximum 'allowed' size of all the corresponding resources on each URL. So for example looking at the second row, there is an allowed budget of 400KB for scripts. Of all the URLs on the website, 541 were under this 400KB budget (i.e. 'passed') and 21 where over the 400KB budget (i.e. 'failed').
Possibly the most useful of these is the row marked 'Image'. Any SEO that has done any work on performance will know that images are often a big cause of poor site performance.
You can use the performance budget table to identify any URLs with images that have a large total weight. This is invaluable for picking out pages where large images are a problem. Similarly, you can use the 'Total' row to pick out pages that are very large in total.
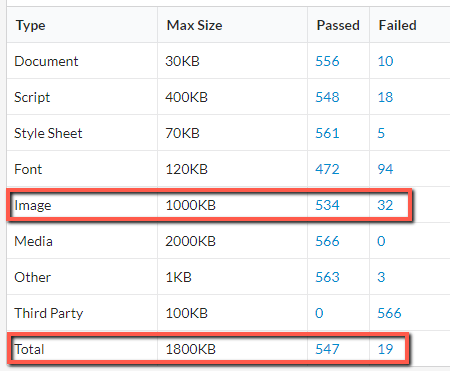
To see the URLs which 'pass' or 'fail' a particular budget, simply click the blue numbers from the corresponding row and column. For example, to find the pages over budget for images, I would click the '32' value in the 'Failed' column in the 'Image' row highlighted above:
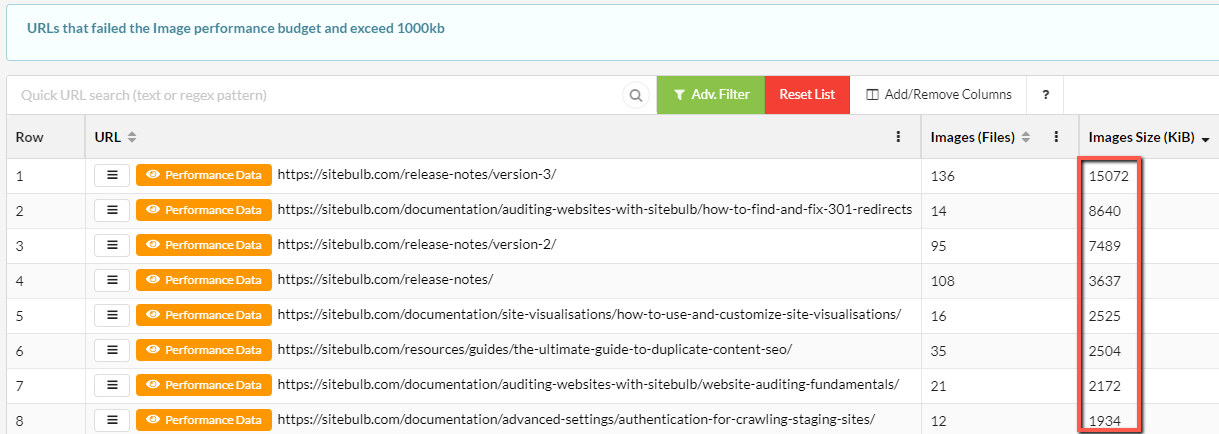
This is a list of pages with a large page weight due to images, as you can see from the column highlighted above.
The process I have just outlined is a simple, straightforward way to use the built-in performance budget data to generate useful insights. To get more from this feature, read the performance budgets documentation itself.
And if you are unsure why you even need to be thinking about performance budgets, check out our Q & A webinar with guest experts Arnout Hellemans and Billie Geena - the recording is available here.
Arnout has been helping companies improve performance by utilising budgets for many years, and discusses this at length on the webinar. Billie also talks about her experience with helping companies optimize site performance of their website, and cites images as being a common culprit.
Sitebulb's combination of performance scores, Web Vitals data, Opportunities & Diagnostics Hints and performance budget gives you everything you need to perform a comprehensive website performance audit.
For further reading on the topic, and to better understand how we believe SEOs should approach performance testing (as opposed to developers, for instance), please check out our guide; What SEOs Need to Know About Core Web Vitals & Performance Testing.