Collecting Web Vitals data with Sitebulb requires the software to run a battery of 'lab' tests to collect the data. This necessarily takes time, in much the same way as Google's PageSpeed Insights or Lighthouse Tools, which both take about 10 seconds to process a single URL.
Fortunately, Sitebulb is a little quicker than that. Depending on the speed of your machine, Sitebulb will take approximately 2 seconds extra for each URL it needs to collect Web Vitals for.
The reason for the increase in time is because Sitebulb (using headless Chromium) has to wait around for the page to completely render and stop moving around; the scripts need to complete and the page has to become interactive.
An extra 2 seconds per URL will add up pretty quickly, consider;
So on really small sites, it is no issue to collect Web Vitals data for every page. But the larger the site becomes, the more onerous it becomes to collect Web Vitals data.
This is why Sitebulb allows you to sample the website when collecting Web Vitals data. In the audit setup, when you click to add 'Performance', you will have the option to select a sample:

Sitebulb samples as it crawls. So if you choose 50% sampling, it will literally sample a URL and then skip the next one. If you choose 10% sampling, it will sample one URL and then skip the next 9.
This means you end up with a broad and (hopefully) representative sample that covers the breadth and depth of the website, allowing you to collect Web Vitals data in a more time-efficient manner.
The sampling only applies to the collection of Web Vitals metrics - it does not apply to the Hints, so even if you sample the site at 10%, you will still get Opportunity and Diagnostic data for 100% of the URLs:

Similarly, the data relating to performance budgets is not sampled either, that is always collected for 100% of the URLs audited.

This means that the sampling option enables you to do a fully comprehensive performance audit without setting your house on fire...
I expect many SEOs will wish to eschew our overly timid and frankly patronising advice entirely, and take matters into their own hands, whacking the sampling up to 100% as soon as humanly possible. Whilst this is theoretically fine, if you are one such SEO, please bear in mind that Web Vitals collection is quite an intensive task, requiring LOTS of internal CPU resource...

Once your audit is complete, head over to the Performance report from the left hand menu. From here, if you select the URLs tab, this will bring you to a full list of all the internal HTML URLs crawled, along with the performance data collected:

Depending on the level of sampling selected, you will see some rows with the scores filled in, and some with no performance data against them (the double dash -- indicates that no data was collected). I hope it goes without saying that the rows with data are the sampled URLs.

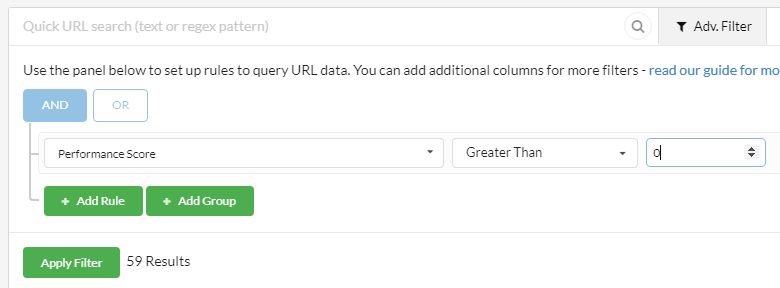
If you wish to view only the URLs with performance data, either click a column header to sort or add a simple filter to the list;

If any of this is alien to you, check out our documentation on How to customize URL Lists.
To reiterate the point, the reason for sampling is so that you can collect Web Vitals data for a broad range of URLs, without spending days doing it and without it causing your laptop to take off. But the Web Vitals data is what you really want, and as mentioned above, this is accessible in table format via the URLs tab.
But you can also access it in graphical format, from the performance overview:

The aggregation and grouping takes into account all URLs tested (i.e. all the sampled URLs), so you can easily click on a segment and jump straight to a list of affected URLs:

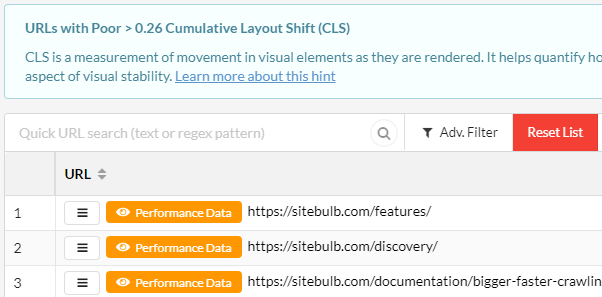
Clicking on the relevant pie chart segment will show you the URLs in question, which allows you to quickly home in on the particularly poor performing pages.

When viewing data sampled data, possibly the most helpful thing you can look for here is URLs that share the same page template. This allows you to build meaningful recommendations for developers as you have taken the time to identify the underlying HTML templates.