Sitebulb crawl data can be automatically collected when audits have finished running, via a system of webhooks.
Webhooks are a way for one application to notify another application about an event that has happened, implemented using HTTP POST requests. Once your webhooks are set up, Sitebulb can send a HTTP POST request including all the top level audit data in the request body.
This data could be used to populate internal (or customer-facing) dashboards, pulled into other applications, or used to trigger other events/automations further down the line.
It is very straightforward to set up webhooks, as long as you have sufficient developer resources to build an endpoint and to interpret the event data.
In Sitebulb Cloud, the Admin user needs to visit the server settings:

From here, navigate to the Webhooks tab:

Initially you will see an optional 'Secret Key' field, along with URL fields for each of the possible events you may wish to set up an endpoint for.
In general, the most useful one is 'Audit Finished URL', as this contains all the top-level data you may wish to use for dashboarding or internal tooling. The others are mostly to notify you regarding the progress of a given audit, or if the audit encountered any issues while crawling.

Once your developer has provided endpoint URLs, enter these in the boxes provided (or the same one into multiple).
If you wish to test the system and/or to give your developer a sample output, click the link to Webhook.site and use the URL they provide:

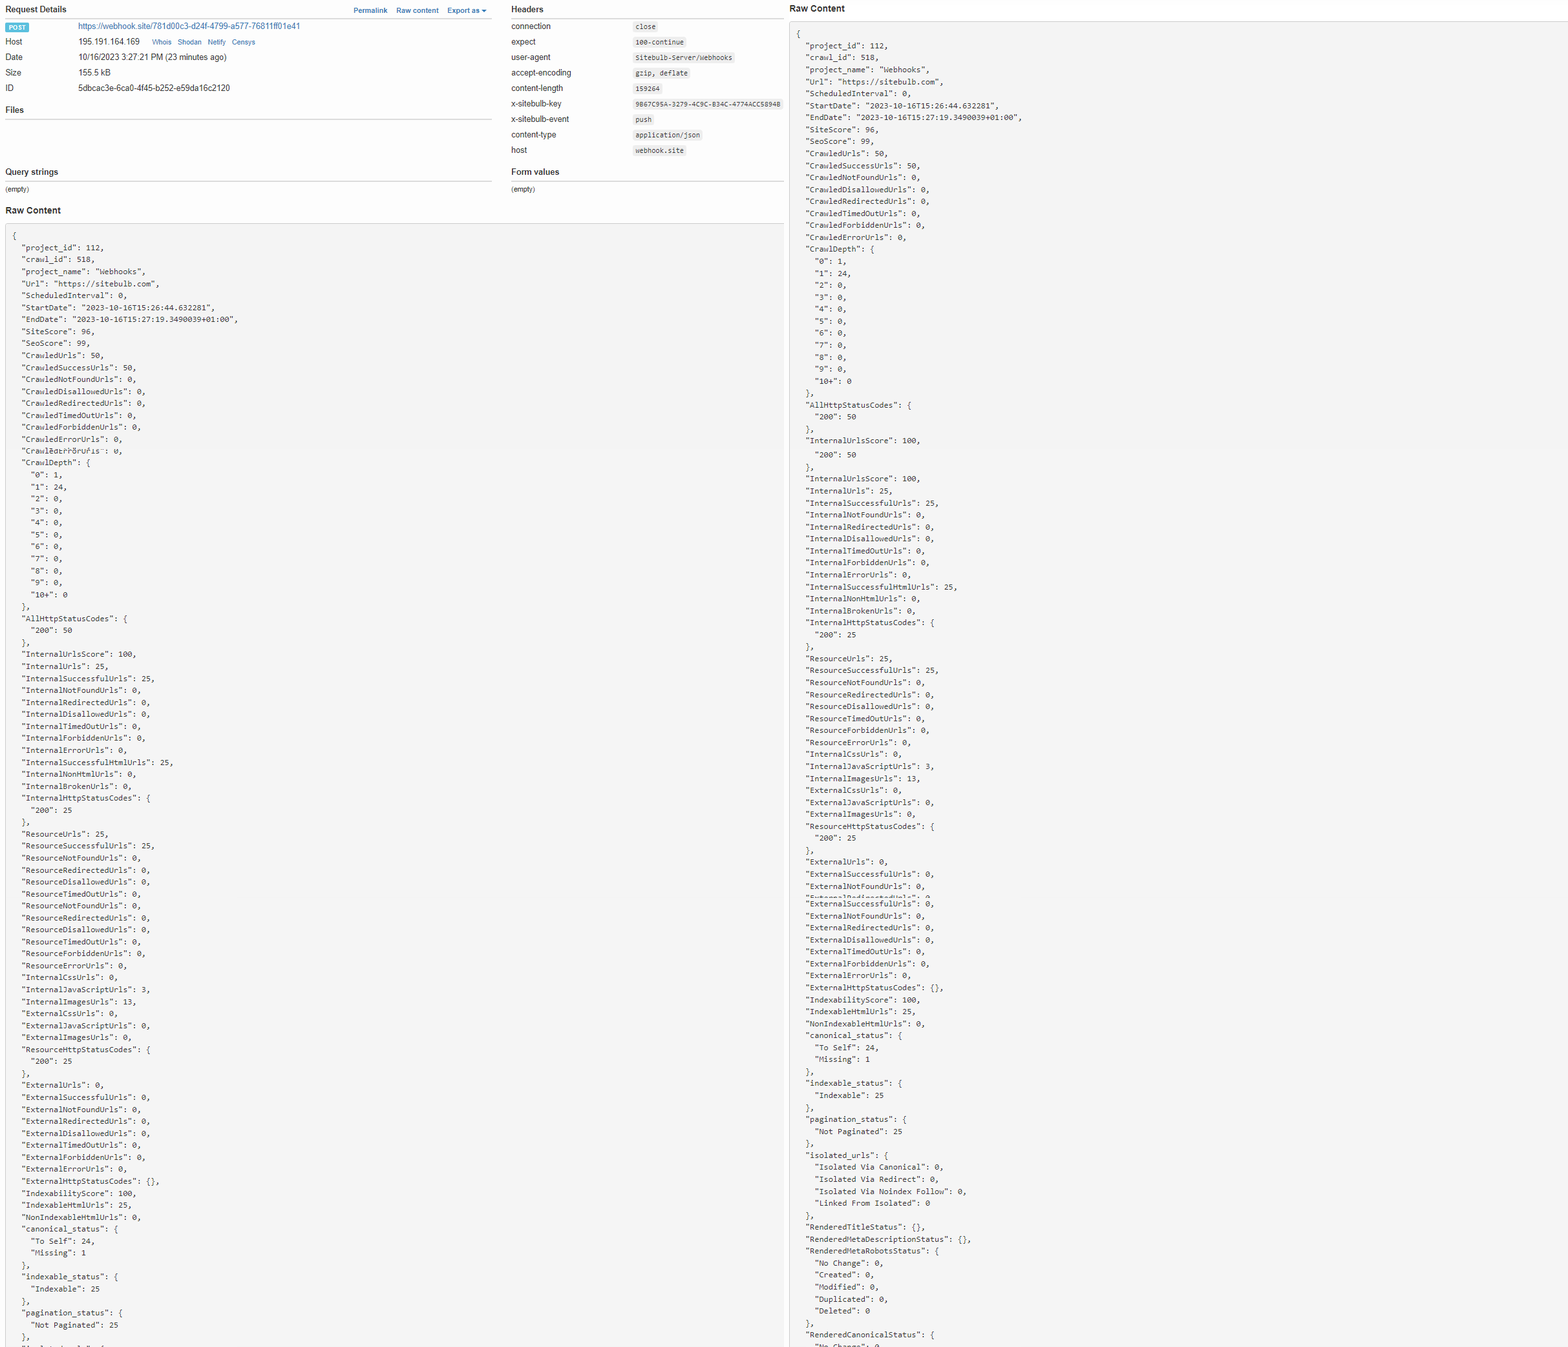
Make sure to hit 'Save', and then once you have run an audit you can check Webhook.site to see the output:

As you can see, Sitebulb will post all the top-level aggregated data from the audit, allowing you to build out automated reports covering: